Insights
A working timeline.
Practical notes on statistical practice, modeling, and analytical tooling — in the order they happened.
-
2025
-
Data viz
Effective Data Visualizations for DataFest
A practical guide to picking and designing high-impact visualizations under the time pressure of ASA DataFest.
-
Quarto
Pre-Workshop Setup: Quarto + GitHub Pages
Install checklist for attendees of a Quarto + GitHub Pages workshop — Git, GitHub, PATs, RStudio.

-
-
2024
-
2023
-
ML
Symptom Severity Classification
Python Random Forest mapping symptom flags to mild / moderate / severe ratings, with extracted rules for clinician review.

-
ML
Predicting $50K+ Salaries
Team ML project on the OpenML census data — PCA feature selection plus a tuned Random Forest reaching kappa 0.95.

-
ML
Customer Return Forecasting
Feature-engineered Random Forest that lifted return prediction from AUC 0.625 to 0.98 on retail data.

-
ML
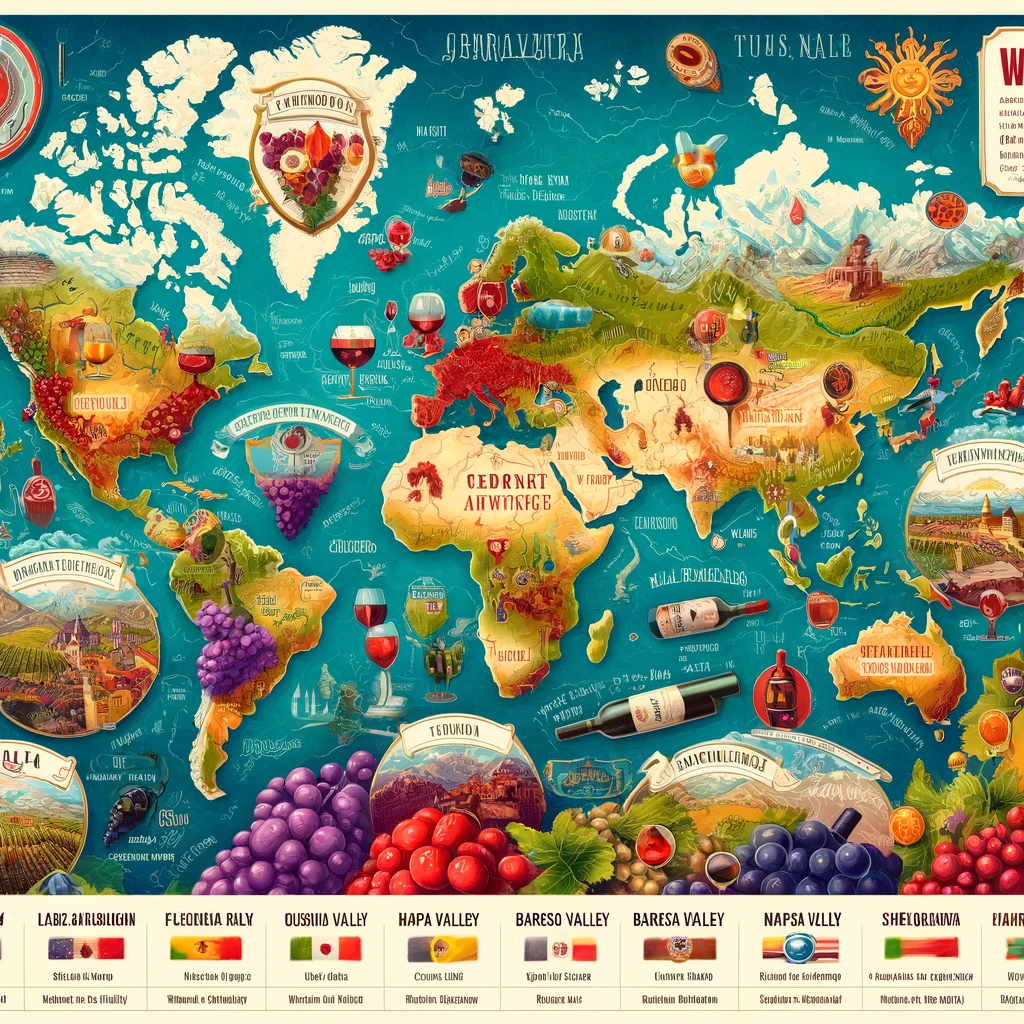
Pinot Province Prediction
NLP-flavored Random Forest that infers a Pinot Noir's province of origin from a critic's tasting notes.
-
-
2022
-
Statistics
U.S. Healthcare Spending, 1980–2014
Longitudinal analysis of U.S. healthcare expenditure by category, region, and state across 35 years.

-
Statistics
The Real Cost of Smoking: Health Insurance Premiums
Quantifying how smoking and BMI drive up insurance premiums by age and gender, in Python.

-